 |
 |
|||||||||||||||||||||||||||||||||||
|
Water tunnel The water tunnel is the main experimental facility of the laboratory. It is aimed to investigate steady and unsteady flows, the motion of rigid bodies in the water, force characteristics of moving bodies, and to model natural and ventilated cavitation.There are two independent test sections in the tunnel: one with round cross-section, and another with rectangular cross-section. This enables to study two-dimensional plane flows and three-dimensional flows. The velocity in working sections is up to 25 m/s at static pressure range from 0.02 to 8 atm. Minimum natural cavitation number obtained in experiments is 0.12. The tunnel has unique design and is all-stainless steel, which provides smooth inner surfaces. The water tunnel height is 18.5 m, the length is 23 m. Circulating pump power is 800 kW, capacity is 3500 l/s. Water mass in the tunnel loop is 250 tons. 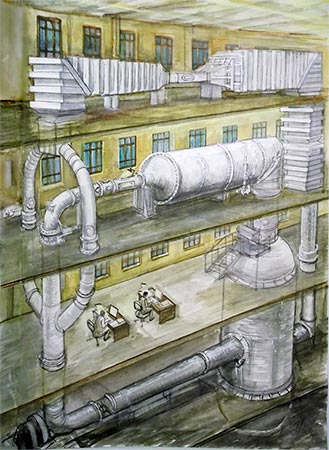
Scheme of the water tunnel (drawing by P.V. Ilishev.) Click to enlarge.
Round test section is 0.4 m in diameter, and 2.4 m in length. It is aimed to investigate three-dimensional bodies, including axisymmetric bodies (bodies of revolution). The section is equipped with the system of air delivery to the model to organize ventilated cavitation. There is an axle drive for testing screws and other bodies. 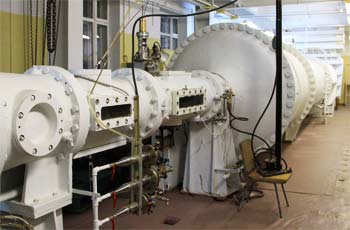
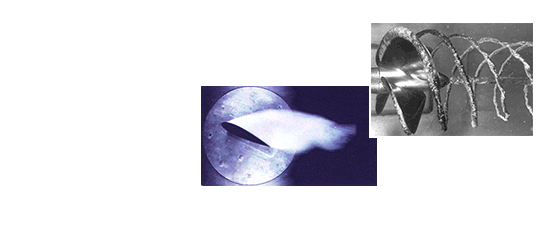
Round test section (left), rectangular test section (right).
The cross-section of rectangular test section has 0.12x1 m size, and 2 m length. It is aimed to model two-dimensional flows (infinite aspect-ratio bodies). The unique testing methodology of half-models in the rectangular test section is developed in the laboratory. The possibility of the air delivery to the model is provided to investigate ventilated cavitation in the rectangular test section.
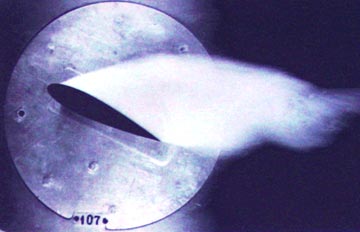
Ventilated cavity formed in the flow around a disk. The flow direction is perpendicular to the disk plane. The air is supplied behind the disk in the radial direction. Fully-developed cavity is formed downstream the disc.
Self-excited oscillations of the cavity formed downstream the counter jet. Velocity of the counter jet exceeds the water flow velocity, which yields the upstream motion of the cavity, its separation from the jet and its downstream drift.
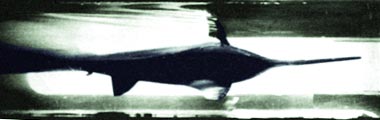
Sword fish model.
Cavitation flow around a wing.
Cleaning of the tunnel inner walls, repair and upgrading of measurement equipment, modernization of tunnel operating system have been made in 2009 – 2013. 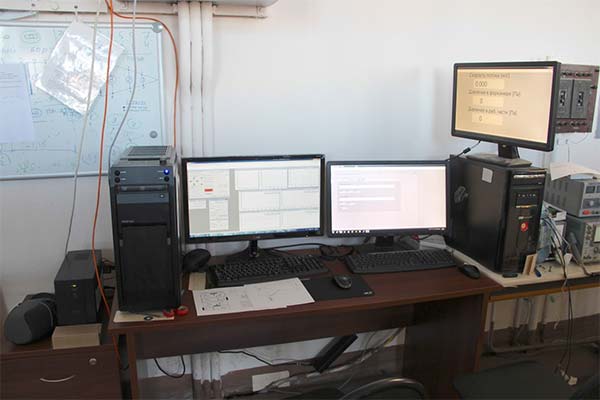
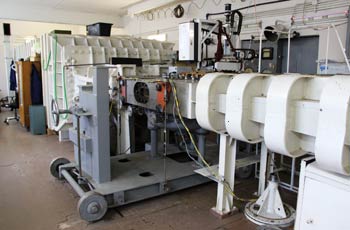
Work place of the water tunnel operator.
All measurements and control of the tunnel are carried out by modern electronic digital systems. The water tunnel is equipped with BD Sensors pressure transducers (for the control of pressure and velocity in test sections), CAS force gauges (three-component force in each test section), multi-tube manometer based on Honeywell pressure gauges, LAD-06 laser Doppler velocimeter, and Polis particle image velocimetry (PIV) system. Measurement systems allow to obtain forces and moments acting on the model, measure pressure distribution along the model surface, obtain detailed three-dimensional flow maps around the model. The unique feature of the water tunnel measurement system is the LAD-06 laser Doppler velocimetry system (LDV) ЛАД–06 (produced by “IOIT”, Novosibirsk). LDV is equipped with traversing and positioning system and is capable of measuring two velocity components, their average values and moments at the targeted point of the flow. The average velocity measurement error is ± 0,5%. 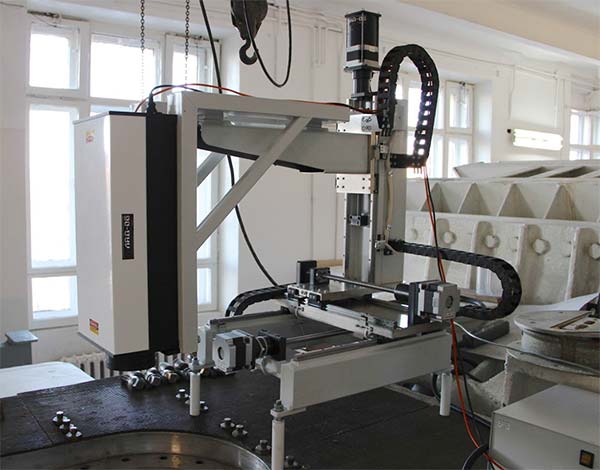
Laser Doppler Anemometer on the positioning system.
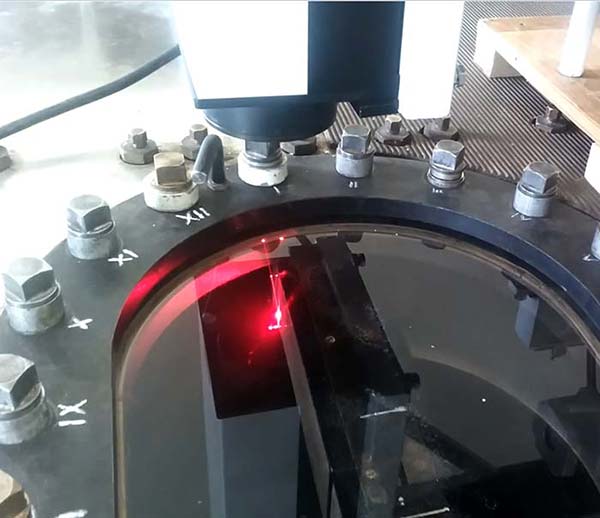
Laser Doppler Anemometer in measuring process.
The step of traversing and positioning system is 0.025 mm, the dimension of measurement volume is 0,05х0,05х1 mm. These characteristics allow to conduct detailed investigations, such as measuring of velocity and turbulent fluctuations profiles in the boundary layers on the tested models (in particular the local value of the friction at the point), detecting zones of transition to the turbulence and boundary layer separation regions, zones of maximum generation of the turbulent fluctuations. 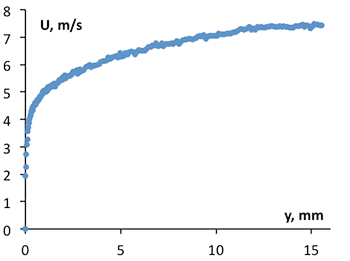
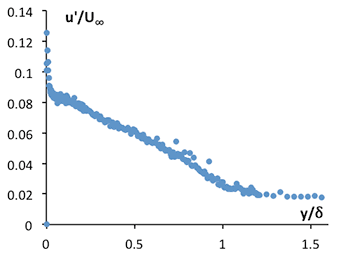
Measured profile of the averaged velocity (left) and its fluctuations (right) in zero pressure gradient turbulent boundary layer; δ is the boundary layer thickness.
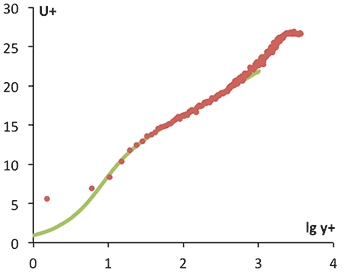
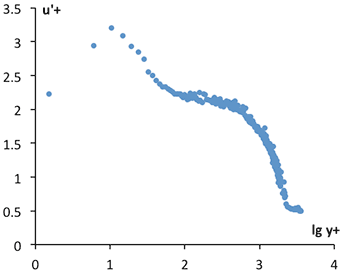
Measured profile of the averaged velocity (left) and its fluctuations (right) in scales of the “law of the wall”. Solid line (left) is the Masker's profile.
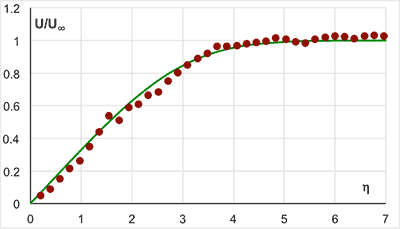
Measured velocity profile in zero pressure gradient laminar boundary layer. Solid line is Blasius profile.
|
|||||||||||||||||||||||||||||||||||
| Last update: june of 2025 | ||||||||||||||||||||||||||||||||||||